
Podcast Reporting Template: Turn Show Metrics Into an Executive QBR
A podcast can generate thousands of downloads and still struggle to justify its marketing budget. The engagement numbers get a polite nod, then someone asks what the show contributed to the sales pipeline, and the room goes quiet.
This question carries more weight when marketing teams have little room to expand spending.
According to Gartner's 2026 CMO Spend Survey, marketing budgets reached 7.8% of company revenue, up slightly from 7.7% in 2025. Meanwhile, 56% of CMOs said they lacked the budget needed to deliver their strategy.
With spending under pressure, podcast reporting needs to connect audience engagement with pipeline, revenue, and measurable business outcomes.
This guide provides a copyable podcast reporting template structured as a nine-slide executive QBR, along with the metric definitions, attribution formulas, and dashboard setup needed to complete it.
P.S. If you'd rather have the reporting built for you, Content Allies' B2B podcast production services include quarterly analysis and a live KPI dashboard.
Key Takeaways
Keep three layers separate: the live podcast analytics dashboard, the monthly podcast report and the quarterly executive QBR.
The executive podcast QBR fits in nine slides: summary, KPI scorecard, reach, engagement, relationship pipeline, revenue, content output, learnings and next-quarter plan.
Report four lanes of metrics (reach, engagement, relationships, revenue) and move vanity metrics to the appendix.
Report podcast-sourced and podcast-influenced pipeline as separate numbers, and never add Spotify plays, downloads and YouTube views into one total.
Set targets from your own trailing baseline first, then sanity-check them against public benchmarks.
Our view, before the template: a B2B podcast is an account-based program that happens to publish audio. Every interview opens a relationship with someone your sales team wants to know, and the audience that matters is the few hundred people who could buy, refer or partner. Who listens matters far more than how many.
So a useful podcast report reads like a pipeline review with a media appendix. Lead with progress against the show's business objectives, then use audience metrics to explain performance.
What Is a Podcast Report, and How Is It Different From a Podcast Analytics Dashboard?
A podcast report is a periodic summary that turns show data into decisions, and a podcast analytics dashboard is the always-on data source the report pulls from. The executive podcast QBR is the quarterly report built for the people who approve budget.
Teams mostly treat these three layers as one deliverable. The usual result is a dashboard export pasted into slides: forty numbers, no recommendation and no target to judge them against. Executives can't act on that, so they default to the one number they recognize, which is usually total downloads.
Each layer answers a different question for a different reader:
| Layer | Purpose | Audience | Cadence | Question it answers | Format |
|---|---|---|---|---|---|
| Podcast analytics dashboard | Monitor live performance | Producer, marketing ops | Always on | What is happening right now? | Looker Studio, Sheets or CRM report |
| Monthly podcast report | Spot trends and fix problems | Marketing team, host | Monthly | What changed, and what do we adjust? | One-page doc |
| Executive podcast QBR | Decide funding and direction | CMO, CFO, sales leader | Quarterly | Is this working, and what do we do next? | 8 to 12 slides |
Build them in that order. The dashboard collects the data, the monthly report keeps the show healthy, and the QBR rolls three monthly reports into one funding conversation.
The Podcast Reporting Template: 9 Slides for an Executive Podcast QBR
Content Allies recommends the nine-slide executive podcast QBR structure below, plus a definitions appendix. Copy the structure, then fill each slide from your dashboard.
| Slide | What goes on it | Data source | Executive question it answers |
|---|---|---|---|
| 1. Executive summary | One result, one recommendation, one ask | All slides below | Should we keep investing? |
| 2. KPI scorecard | 6 to 8 KPIs against target and last quarter | Dashboard | Are we on track? |
| 3. Audience reach | Downloads, listeners, plays, views by platform | Host, Apple, Spotify, YouTube | Is the audience growing? |
| 4. Listener engagement | Engaged listeners, completion, consumption | Apple, Spotify, YouTube | Is the content holding attention? |
| 5. Relationship pipeline | Guests from target accounts, follow-up meetings | CRM, guest tracker | Is the show opening doors? |
| 6. Revenue | Sourced and influenced pipeline, closed revenue | CRM | What did it return? |
| 7. Content output | Assets produced, cost per asset | Production log, budget | What else did we get for the spend? |
| 8. Wins, misses, learnings | What worked, what didn't, what we tested | Monthly reports | What did we learn? |
| 9. Next-quarter plan | Priorities, owners, budget ask | Team | What happens next? |
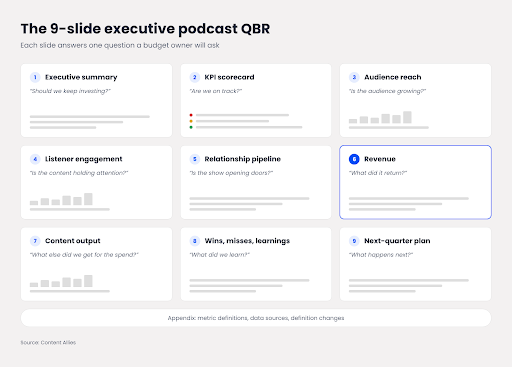
The nine-slide executive podcast QBR, with the executive question each slide answers. Source: Content Allies original
1. Executive Summary: One Result, One Recommendation
The executive summary slide states the quarter's headline result, one recommendation and one ask, in three sentences or fewer. Write it last, after every other slide is finished.
A strong version reads like this: "The show sourced four opportunities worth $180,000 this quarter, up from one. We recommend shifting two episodes a month to target-account guests. We need approval to keep the current budget through Q3."
Avoid causal claims you can't support. "Influenced" and "sourced" are defensible; "caused" usually isn't.
2. Podcast KPI Scorecard Against Target
The KPI scorecard shows six to eight metrics, each with this quarter's actual, its target, last quarter's actual and a red, amber or green status. It's the slide executives return to, so keep it stable from quarter to quarter.
Pick roughly two KPIs per lane: one reach metric, one engagement metric, two relationship metrics, two revenue metrics and one or two efficiency metrics. Swapping KPIs every quarter makes trends impossible to read and invites the question of what you're hiding.
3. Audience Reach Across Apple, Spotify and YouTube
The reach slide shows audience size by platform, with each number labeled by its source and definition. Show the platforms side by side, following the reconciliation rules later in this guide.
Video belongs on this slide now. 57% of Americans age 12+ have both listened to and watched podcasts (Edison Research, Infinite Dial 2026). And YouTube reported more than 1 billion monthly podcast viewers in early 2025.
If you publish full episodes on YouTube, report views and watch time alongside audio downloads, and see our guide to running a B2B podcast on YouTube for the channel setup.
4. Listener Engagement and Completion
The engagement slide shows whether people finish what they start: engaged listeners, completion rate and average consumption, compared across the quarter's episodes in a fixed window. Retention curves from Apple and YouTube show where attention drops inside an episode.
Use the same post-publish window for every episode (seven or thirty days), or newer episodes will always look worse. Call out the one or two episodes that held attention best and say what they had in common, such as guest seniority, topic or length.
5. Guest and Target-Account Relationship Pipeline
The relationship slide tracks what most podcast reports skip: how many guests came from your target-account list, and what happened after the recording. This is where a B2B show earns its budget.
Report these four numbers each quarter:
Guests booked, and the share from target accounts
Follow-up meetings held with guests or their colleagues
Opportunities opened at guest accounts
Referrals or introductions guests made
6. Podcast-Sourced and Influenced Revenue
The revenue slide reports podcast-sourced pipeline, podcast-influenced pipeline and closed revenue as three separate lines, each pulled from the CRM.
Content Allies' own show, Leaders of B2B, is the reference case: it engaged 94 C-level executives, generated 43 sales opportunities and produced $100,500 in attributable revenue within its first four months.
Show the deals behind the numbers. One named opportunity with a short story ("the VP of Ops we interviewed in March introduced us to her CFO") persuades a CFO faster than a pipeline total.
7. Content Output and Cost per Asset
The content slide counts what each episode turned into (clips, articles, newsletter sections, sales enablement snippets) and divides program cost by that count. Report documented avoided content expenditure separately from cost per asset.
Report the trend alongside the total. Track whether cost per asset falls as the workflow matures and your team repurposes podcast content systematically.
8. Wins, Misses and Learnings
The learnings slide lists one win, one miss and one experiment result, one sentence each. Detail goes to the appendix.
Executives trust reports that admit misses. A line like "Short-form clips drove impressions but no site traffic; we're cutting them to two per episode" earns more credibility than a slide of green arrows.
9. Next-Quarter Plan, Budget Ask and Owners
The final slide sets three to five priorities for next quarter, each with an owner, a due date and the metric that will show success. End with the specific decision you need from the room.
Close the slide with an appendix of metric definitions, data sources and any definition changes during the quarter. That appendix answers the "where does this number come from?" questions before anyone asks them.
Free Podcast Report Template to Copy and Paste
Copy the template below into a doc or slide outline, replace each bracket, and keep the header fields identical every quarter so the numbers stay comparable.
[Show name] podcast QBR: [Quarter and year]
Prepared by: [Owner]
Data pulled on: [Date]
Download source: [Hosting platform or measurement prefix]
Episode comparison window: [7 or 30 days after publish]
Compared with: [Previous quarter]
1. Executive summary
- Result: [One sentence with the headline number]
- Recommendation: [One sentence]
- Ask: [The decision you need]
2. KPI scorecard
[KPI] | [Actual] | [Target] | [Last quarter] | [Red / amber / green]
3. Audience reach
[Platform] | [Metric and definition] | [This quarter] | [Last quarter]
4. Listener engagement
[Engaged listeners] | [Completion rate] | [Best episode and why]
5. Relationship pipeline
[Guests booked] | [From target accounts] | [Follow-up meetings] | [Opportunities opened]
6. Revenue
[Podcast-sourced pipeline] | [Podcast-influenced pipeline] | [Closed revenue] | [One named deal story]
7. Content output
[Assets published] | [Cost per asset] | [Trend]
8. Wins, misses and learnings
Win: [ ] Miss: [ ] Experiment result: [ ]
9. Next-quarter plan
[Priority] | [Owner] | [Due date] | [Success metric]
Appendix: metric definitions, data sources, definition changes ("None" if nothing changed)
Pro tip: For a monthly podcast report, keep the header and slides 2 to 6 and replace slides 1, 8 and 9 with a short list of decisions and owners.
Which Podcast Metrics Belong in an Executive Report?
An executive podcast report should cover metrics from four categories: reach, engagement, relationships, and revenue. Keep the main report focused on metrics that help executives evaluate performance and make budget decisions. Move the remaining details to the appendix
Platform definitions matter more than most teams realize, because two numbers with the same name can count different things. Our breakdown of the most valuable B2B podcast KPIs covers how KPI choice differs for SMB and enterprise shows.
The table below defines each metric and recommends its placement in the executive QBR. Headline metrics appear prominently on the relevant slide because they indicate audience engagement or business impact. Supporting metrics provide additional context and can appear below the main figures or in the appendix.
| Metric | Platform definition | Why an executive cares | QBR Placement |
|---|---|---|---|
| Downloads | One download per IP and user agent per 24 hours, with at least one minute of content delivered (IAB guidelines) | Industry-standard reach figure | Supporting |
| Apple listeners | People who played more than zero seconds | Unique audience on Apple | Supporting |
| Apple engaged listeners | People who heard or watched at least 20 minutes or 40% of an episode | Sustained attention on Apple | Headline |
| Spotify plays | Listens or views of at least 30 seconds, since June 11, 2026 | Reach on Spotify | Supporting |
| Spotify completion rate | Share of audience reaching 95% of an episode in its first 7 days | Content quality signal | Headline |
| YouTube watch time and average view duration | Total and average time watched | Video reach and attention | Supporting |
| Company-level listeners | Estimated company-level listener matches from audience-intelligence tools | Whether target accounts are listening | Headline |
| Guest-to-opportunity rate | Distinct guest accounts generating a new qualified opportunity / distinct interviewed guest accounts, using the same interview cohort and a defined follow-up period | Relationship return | Headline |
| Influenced pipeline | Open pipeline with at least one podcast touch | Revenue contribution | Headline |
Keep chart rankings, review counts, raw social impressions, and geographic data out of the main QBR. Geography becomes relevant when the podcast targets specific regions. In that case, include a brief geographic breakdown under reach and keep the detailed map in the dashboard.
How to Attribute Pipeline and Revenue to a B2B Podcast
Attribute podcast revenue by combining CRM tagging of guests and engaged accounts, a self-reported attribution field and account-level listener data, then report sourced and influenced pipeline separately. No single method captures it alone.
Last-touch attribution may miss podcast activity that occurs before a prospect's final conversion touch. In 6sense's 2025 research, 94% of buying groups ranked their preferred vendors before first contact and bought from that vendor 77% of the time.
These findings support the importance of activity before sales contact; they do not establish podcast influence. A podcast may contribute during that period. Our B2B podcasting ROI framework splits metrics across the funnel. The five methods below help document podcast touchpoints for the QBR.
1. Podcast-Sourced and Podcast-Influenced Pipeline Definitions
Podcast-sourced pipeline includes opportunities with documented evidence that the podcast was the first meaningful acquisition touch. A guest becoming a buyer is insufficient on its own. Classify existing relationships as podcast-influenced only when a qualifying podcast touch is documented.
Podcast-influenced pipeline is open opportunity value with at least one documented, qualifying podcast touch. It can include podcast-sourced opportunities, so the categories overlap. Do not add sourced and influenced pipeline together.
We suggest reporting both. Sourced identifies opportunities originated through the podcast under your documented attribution rules. Influenced identifies opportunities with qualifying podcast activity; it does not establish incremental revenue.
2. Guest-to-Opportunity Tracking in the CRM
Tag every guest and their company in the CRM the day the interview is booked, then track meetings, opportunities and closed-won deals against that tag. This is the most direct revenue line a B2B show has.
The method depends on booking guests from your target-account list in the first place, which our ABM podcast strategy guide walks through. The outreach behind it is measurable too: Disruptive Innovators' guest outreach reached 5,300 recipients, engaged 311, booked 63 calls and produced 31 new CRM leads.
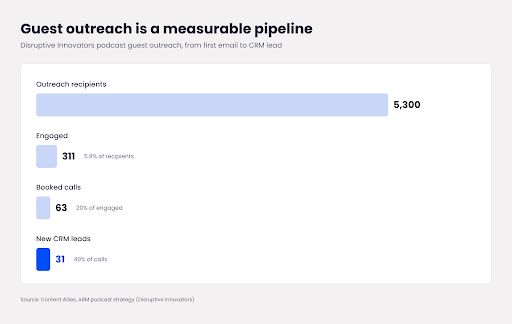
Guest outreach for Disruptive Innovators turned 5,300 recipients into 31 new CRM leads. Source: Content Allies
3. Self-Reported Attribution Field
Add an open-text "How did you hear about us?" field to demo and contact forms, then code any answer that names the show, the host or an episode. It catches the podcast influence your tracking links miss.
An open-text field can capture the show, episode or recommendation that prompted the enquiry. Self-reported answers can be incomplete or affected by recall, so corroborate them with other evidence where available.
Social attribution works the same way: when a prospect says they found you through a LinkedIn clip of an episode, code it to the podcast and note the channel.
4. Account-Level Listener Data
Audience-intelligence tools and contextual ad platforms can show which companies are listening, and that audience insight becomes useful once you match it against your target-account list. The QBR question is how many target accounts engaged this quarter.
Treat this data as directional and label company-level listener matches as estimates. A company match does not prove that a particular buyer listened. Require additional evidence of a qualifying podcast touch before attaching the activity to an opportunity.
5. Episode CTAs, UTM Links and Landing Pages
Give every episode one tracked link and one specific offer, such as a worksheet, a benchmark report or a related case study. A tracked link per episode shows which topics drive action.
Put the link in show notes, the YouTube description and every social clip, each with its own UTM source. Our guide to B2B podcast lead generation covers how to write episode-specific CTAs that people actually click.
Podcast ROI Formula Sheet
Use these formulas to fill slides 6 and 7. The worked examples are illustrative, so replace them with your own numbers.
For revenue and ROI, use recognized revenue from documented podcast-sourced deals, not bookings. Match that revenue cohort with the program costs that generated it. Simple revenue-based marketing ROI does not establish profit or incremental return.
| Metric | Formula | Worked example (illustrative) |
|---|---|---|
| Podcast-influenced pipeline | Sum of open opportunity value with at least one podcast touch | $420,000 across 12 deals |
| Podcast-sourced revenue | Recognized revenue from closed-won deals with documented podcast-first acquisition | $95,000 recognized revenue from 2 sourced deals |
| Cost per newly sourced opportunity | Program cost for the reporting period / distinct new podcast-sourced opportunities created in that period; deduplicate opportunity IDs | $15,000 / 12 = $1,250 |
| Simple revenue-based marketing ROI | (Recognized sourced revenue - matched program cost) / matched program cost × 100 | ($95,000 - $15,000) / $15,000 × 100 ≈ 533%; revenue / cost = 6.33x |
| Cost per asset | Quarterly program cost / assets published | $15,000 / 120 = $125 |
| Sales-cycle difference | Average days to close without a podcast touch – with a podcast touch | 210 – 165 = 45 days faster |
Program cost should include production, promotion and internal time. If you need a reference point for that input, our breakdown of what B2B podcasting costs covers typical ranges by service model.
How to Set Podcast KPI Targets and Benchmarks
Set podcast KPI targets from your own trailing two-quarter baseline, then sanity-check them against public benchmarks. Your own history predicts your next quarter far better than an industry average does.
Public download benchmarks are useful mainly for context. Buzzsprout, a podcast hosting platform, publishes first-seven-day download percentiles across the shows it hosts. The table below uses its September 2026 data:
| Percentile | Downloads per episode in first 7 days (September 2026) |
|---|---|
| Top 50% | 27 |
| Top 25% | 96 |
| Top 10% | 412 |
| Top 5% | 1,007 |
| Top 1% | 4,586 |
These figures skew toward small, independent shows, and they move month to month. A niche B2B show with 150 downloads per episode can still beat its targets if those listeners are the right buyers, which is why the relationship and revenue lanes carry more weight on the scorecard.
Set expectations by quarter to account for the buying journey. 6sense's 2025 survey found an average B2B buying cycle of about ten months, including research before seller contact. A realistic sequence:
Quarter 1: Guests booked from target accounts, publishing consistency, engaged listeners
Quarter 2: Follow-up meetings, first influenced opportunities, completion trends
Quarter 4: Sourced revenue, cost per newly sourced opportunity, sales-cycle difference
Fill a target sheet like this for every KPI on slide 2:
| KPI | Baseline (last 2 quarters) | Target this quarter | Red threshold |
|---|---|---|---|
| Engaged listeners per episode | 180 | 210 | Below 160 |
| Target-account guests | 6 | 9 | Below 5 |
| Podcast-influenced pipeline | $300,000 | $400,000 | Below $250,000 |
How to Reconcile Podcast Analytics Across Apple, Spotify, YouTube and Your Host
Reconcile podcast analytics by choosing one IAB-certified source for downloads, keeping every other platform's numbers in separate rows, and footnoting any definition change. Unreconciled numbers are the fastest way to lose a CFO's trust.
Follow these steps before each QBR:
Choose one source of truth for downloads, ideally your hosting platform or an IAB-certified measurement prefix, and use it every quarter.
Report Apple listeners, Spotify plays and YouTube views in their own rows. Never add them to downloads, since one person can appear in several counts.
Compare episodes in a fixed window. Apple Podcasts Connect's Performance tab compares episodes at 7, 14, 30 or 60 days after release, so pick one window and keep it.
Footnote definition changes. Spotify moved its play threshold to 30 seconds on June 11, 2026, and IAB Tech Lab released Podcast Measurement Guidelines v2.3 in September 2026, replacing v2.2 from May 2024.
Log any change of host, prefix or analytics tool, with the date, so a sudden jump or drop has an explanation on file.
How to Build a Podcast Analytics Dashboard That Feeds the QBR
Build a podcast analytics dashboard by connecting your host, Apple, Spotify, YouTube and CRM data into one view with four rows that mirror the QBR lanes. If the dashboard matches the slides, the QBR takes an afternoon to assemble.
Follow this sequence:
List every data source and the metric you'll take from each, using the metric table above.
Pick the tool. Looker Studio or Google Sheets works for most teams; HubSpot or Salesforce dashboards work when revenue data already lives there.
Connect the data. Most hosts and YouTube offer connectors or an API; Apple and Spotify data usually arrives by CSV export on a set day each month. Our review of B2B podcast analytics platforms compares which tools connect to what.
Add a target column next to every KPI, copied from your target sheet.
Schedule the refresh and name an owner for the manual exports.
Save a snapshot at the end of each quarter so QBR numbers never shift after the meeting.
Lay the dashboard out in four rows:
Row 1, KPI tiles: The six to eight scorecard KPIs with target and status
Row 2, reach and engagement: Downloads, engaged listeners, and completion trended by month
Row 3, relationship pipeline: A table of guests, accounts, meetings and opportunity status
Row 4, revenue: Sourced and influenced pipeline, closed revenue and cost per newly sourced opportunity
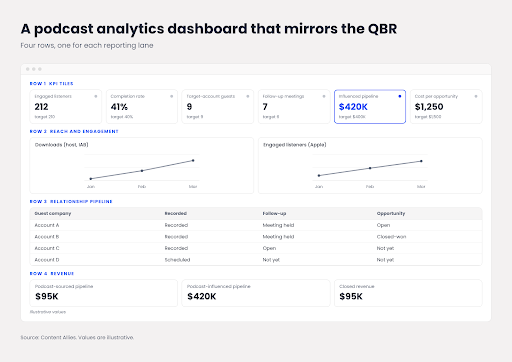
A four-row podcast analytics dashboard that mirrors the QBR lanes. Source: Content Allies original
| Tool | Best for | Data it covers |
|---|---|---|
| Looker Studio | Free, shareable dashboards | Sheets, YouTube, GA4, CSV imports |
| Google Sheets | Small teams and manual exports | Anything exported as CSV |
| HubSpot or Salesforce reports | Revenue lanes | CRM deals, contacts, form fields |
| CoHost | Company-level listener data | Host downloads, account identification |
How to Present a Podcast QBR to the CMO and CFO
Present a podcast QBR by leading with the business result and the recommendation, keeping the meeting to 30 to 60 minutes, and moving definitions to the appendix. The opening slide carries most of the decision.
Executive attention is short because every channel is competing for the same flat budget. Prepare for the questions each executive will bring:
| Executive question | Slide that answers it | Evidence to bring |
|---|---|---|
| Is this worth the money? | 1 and 6 | Sourced revenue, cost per newly sourced opportunity |
| Are we reaching the right people? | 5 | Named target-account guests and engaged accounts |
| Is it getting better? | 2 | Quarter-over-quarter KPI trend |
| What else does it give us? | 7 | Cost per asset, sales enablement usage |
| What do you need from us? | 9 | One specific budget or resourcing decision |
Prepare on this timeline:
Three weeks out: Pull the quarter's dashboard snapshot and CRM report.
Two weeks out: Draft slides 2 to 8, then slide 1.
One week out: Review revenue numbers with sales ops, rehearse, and cut any slide that fails the "so what?" test.
Be explicit about uncertainty: carry the estimate labels from your attribution slides into the meeting, and say when a quarter is too early to judge revenue.
Thought leadership reaches buyers well beyond your contacts; 41% of target buyers in the Edelman-LinkedIn 2025 study said a C-suite executive had encouraged them to consider a vendor after seeing its thought leadership. This reach rarely shows up in a CRM field, and saying so plainly makes the numbers you do report more credible.
Turn Your Podcast Into a Reportable Revenue Channel With Content Allies
A podcast report only works when the program behind it was built to produce measurable relationships and pipeline. Content Allies plans every show around that from day one.
We book guests from your target-account list, produce and promote every episode, and tag guests and engaged accounts so revenue attribution lands in your CRM. Every client gets a live dashboard pulling podcast stats, YouTube plays, LinkedIn, ads and web traffic into one view, plus quarterly analysis you can take straight into the boardroom.
If you want your next podcast QBR to answer the funding question with confidence, book a strategy call. We'll review your current show, your reporting setup and the metrics your leadership team cares about, then map what a revenue-focused program would look like.
FAQs
How do you report podcast ROI when the sales cycle is longer than a quarter?
Use the quarter-by-quarter sequence from the targets section, and add one line to the revenue slide listing influenced opportunities still open and their stage, so leadership can see revenue that hasn't closed yet. Say on the slide which stage the program is in.
Should YouTube video podcast views be added to audio downloads in a QBR?
No. Keep them in separate rows, as the reconciliation steps describe. If leadership insists on one audience figure, report the largest single-platform unique-audience estimate and label its source and period. The combined audience may be higher, but cross-platform overlap is unmeasured.
How do you handle the Spotify play-definition change in quarter-over-quarter comparisons?
Spotify changed its play-counting methodology on June 11, 2026, to count listens or views lasting at least 30 seconds. Add a note explaining this change wherever Spotify plays appear in your report. For quarters spanning the change, report figures before and after June 11 separately to avoid misleading comparisons. Use completion rates and engaged listeners to assess engagement trends.
What should a QBR show for a show under 500 downloads per episode?
Lead with the relationship and revenue lanes. A small B2B show is usually a guest-access program first, so target-account guests, meetings and influenced pipeline tell the real story.
Upshift, which runs a top-ranked hospitality-industry podcast, converted over half of its podcast interviews into new revenue opportunities, a result no download chart would show. Keep downloads on the reach slide, but don't make them the headline.
Who should own the podcast report: marketing ops, the agency or the host?
Marketing ops or the program owner should own the QBR, with the agency supplying production and platform data. The owner needs CRM access to report revenue lanes. Hosts contribute guest context and relationship follow-up, but shouldn't be the ones assembling numbers.