
How to Improve Podcast Retention and Fix Listener Drop-Off
Downloads used to be the headline metric for podcast performance. But platforms are giving creators more ways to see what happens after someone presses play.
Spotify now counts a play after 30 seconds of listening, while Apple Podcasts identifies "engaged listeners" who hear at least 20 minutes or 40% of an episode.
Getting someone to start an episode is only part of the job. Podcast retention shows how long listeners stay, where they leave, and which parts of an episode hold their attention.
This guide explains where to find your listener drop-off data, how to interpret the retention curve, and what you can change to keep more listeners engaged.
P.S. If you'd rather have a team analyze the drop-off points and edit around them, our B2B podcast production service builds each episode with listener retention in mind.
TL;DR
Podcast retention has two parts: how much of an episode people hear, and whether they come back for the next one.
Most audio shows land between 50% and 70% average consumption. Above 70% is strong.
Spotify, Apple Podcasts Connect and YouTube Studio each show a drop-off view, under different names.
The fixes with the biggest payoff are a cold open, editing to pace, and building each interview around one promised outcome.
For a B2B show, the question is who stayed. What counts is a short list of engaged listeners from target accounts who stay past minute four.
At Content Allies, we treat a retention curve as a script review. Every dip is a timestamp, and every timestamp points at a sentence, a segment or an edit decision someone made. This makes most drop-off fixable after the recording, in structure and editing, long before you need a bigger guest or a new format.
Retention shows audience attention. Assess sales impact separately through CRM attribution and account engagement.
What Is Podcast Audience Retention?
Podcast audience retention measures how much of each episode listeners hear and whether they return for the next one. Those are two different metrics, and platforms label them differently.
In-episode retention covers completion, consumption and the retention curve: the line showing what share of listeners is still there at each moment.
Some tools call this listen-through rate. Return-listener retention covers the people who come back episode after episode.
The naming trap catches a lot of teams. In Spotify for Creators, the metric called "retention rate" is the share of your audience that returns week over week. Spotify's in-episode metric is completion rate, which only counts listeners who reach 95% of an episode.
| Platform | Metric name | What it measures | Threshold or window |
|---|---|---|---|
| Spotify for Creators | Completion rate | Share of listeners who finish an episode | 95%+ of the episode, first 7 days |
| Spotify for Creators | Retention rate | Share of the audience returning week over week | Weekly |
| Apple Podcasts Connect | Average Consumption | Average share of an episode played per device | Data from 5 unique listeners |
| Apple Podcasts Connect | Engaged Listeners | Listeners who heard a meaningful portion | 20 minutes or 40% of an episode |
| YouTube Studio | Average percentage viewed | Average share watched by engaged viewers | Per video |
| YouTube Studio | Key moments: Intro | Share still watching after the opening | First 30 seconds |
Apple's definitions come from its listener analytics guide. Downloads, unique listeners and the rest of the audience-size metrics are covered in our guide on how to find podcast listenership, so this article stays on retention.
What Is a Good Podcast Retention Rate?
A good podcast retention rate for audio is 50% to 70% average consumption, and anything above 70% is strong. Video podcasts on YouTube run far lower because viewers sample before they commit.
Is 20% retention good? For a YouTube video podcast, it sits near the 23.7% all-category average in the table below. For an audio episode, it means most listeners leave early.
Don't compare audio and video numbers head to head. Apple averages consumption per device across everyone who pressed play. YouTube's average percentage viewed is calculated from engaged views, and YouTube viewers browse more casually, so a 35% video and a 65% audio episode can reflect the same quality of content.
One episode is also a weak benchmark. Calculate your own median Average Consumption across five to ten comparable episodes.
Episode length plays into all of this, and we've covered the length question separately in our data on how long a B2B podcast should be.
How to Find Where Listeners Drop Off in Spotify, Apple Podcasts, and YouTube
Each platform shows drop-off in a different place: the episode Analytics tab in Spotify for Creators, the Episodes and Performance tabs in Apple Podcasts Connect, and the audience retention report in YouTube Studio. Start with whichever platform carries most of your audience, then check the others for the same pattern.
Find the Drop-Off Point in Spotify for Creators
Log in to Spotify for Creators and open Episodes.
Select an episode, then open the Analytics tab.
Review the episode's performance chart for the shape of the audience retention graph and the 25%, 50% and 75% quartile markers.
Open the Discovery tab to see the average completion rate (the completion threshold in the table above).
Use the first-time and returning audience split, added in June 2026, to see whether new listeners drop off earlier than fans.
Spotify's completion rate and episode completion quartiles measure listening during the first seven days after release. Compare these metrics after each episode has had a full week to collect data; other episode analytics support different time windows.
Find the Drop-Off Point in Apple Podcasts Connect
Sign in to Podcasts Connect and open Analytics for your show.
Open the Episodes tab and sort by Average Consumption.
Open an episode to see its listening chart and where listeners skip or leave.
Switch to the Performance tab and compare episodes at 7, 14, 30 or 60 days after release against your median, average or top episode.
Apple only shows data once an episode has at least five unique listeners. Apple's own guide frames the use case directly: are listeners skipping your intro or your second mid-roll?
Find the Drop-Off Point in YouTube Studio
Sign in to YouTube Studio and select Content.
On the episode video, select Analytics.
Open the Overview or Engagement tab and find the audience retention report.
Read the key moments: Intro (the share still watching after 30 seconds), Top moments, Spikes and Dips.
Select See more to compare against your videos of similar length.
YouTube requires videos to be at least 60 seconds long with at least 100 views for highlighted key moments. Retention data takes one to two days to process.
If you run several shows or need listener-level data, third-party tools like CoHost and Casted add firmographic and episode-level reporting. We compared them in our roundup of B2B podcast analytics platforms.
How to Diagnose Podcast Listener Drop-Off by Timestamp
Diagnose podcast listener drop-off by matching the timestamp where the curve falls to what was playing: an early drop points to the intro, a mid-episode cliff to one segment, and a late slide to a long wind-up.
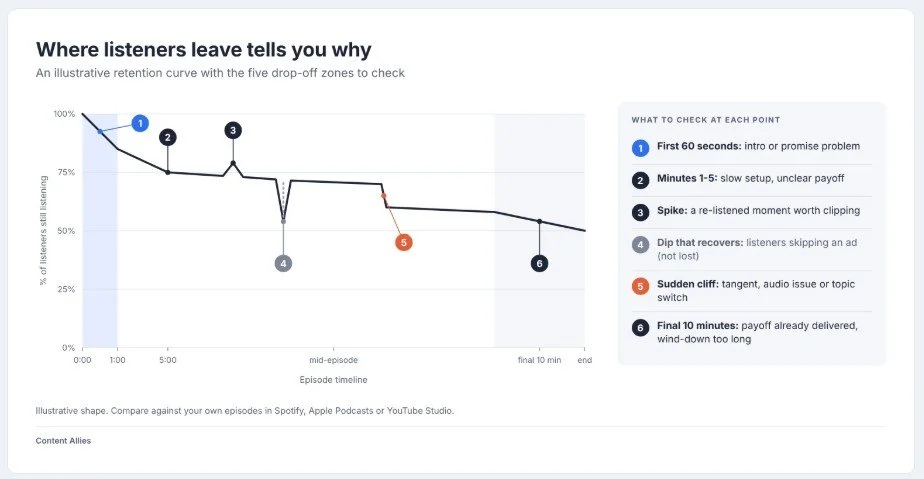
Where listeners leave tells you why: an illustrative retention curve with the zones to check. Source: Content Allies
| Where the curve drops | What it usually means | What to check in the audio | First fix to try |
|---|---|---|---|
| First 60 seconds | The opening didn't confirm the episode is worth their time | Theme music length, housekeeping, a slow greeting | Cold open with the payoff |
| Minutes 1 to 5 | Setup runs long before the first real answer | Guest bio, warm-up questions, context nobody asked for | Move the strongest answer forward |
| Steady slope through the middle | Pacing is even and flat | Long answers, repeated points, no signposting | Edit to pace |
| Sudden cliff mid-episode | Something specific pushed people out | A tangent, an audio problem, a topic switch | Cut or fix that segment |
| Dip at the ad break that recovers | Listeners skipped ahead | Whether the curve returns to its pre-ad level | Usually nothing |
| Final 10 minutes | The payoff already landed | Long wrap-up, stacked CTAs, rambling outro | Shorter close, one CTA |
| Finished but didn't return | No reason to come back | The ending and the next-episode hook | Return-listener tactics |
The ad-break dip deserves its own warning. Spotify's guidance on reading episode performance notes that in most cases the retention curve "normalizes back to where it was before the ad," meaning most listeners are just skipping ahead. Treating that dip as lost audience leads teams to cut sponsor reads that weren't costing them anything.
Spikes are worth as much attention as dips. Spikes identify moments to review for rewatching, sharing or possible confusion.
Pacing problems are the hardest to see in one episode. A gentle slope across 20 minutes looks normal until you line up five episodes and see it on every one. So, we recommend comparing three to five episodes before acting, and looking for a pattern that repeats at the same kind of moment: the same segment type, the same guest question, the same transition.
How to Improve Podcast Retention: 8 Fixes Ranked by Impact
The fastest way to improve podcast retention is to fix the opening, then edit for pace, then restructure how interviews are built. The table ranks all eight fixes by the retention impact we usually see, with the effort each takes.
| Fix | Drop-off it targets | Effort | Best for |
|---|---|---|---|
| 1. Cold open | First 60 seconds | Low | Every show |
| 2. Edit to pace | Middle slope and cliffs | Low to medium | Interview shows |
| 3. One promised outcome per interview | Minutes 1 to 5 | Low | Guest-led B2B shows |
| 4. Host training | Middle slope | High | Shows with a new or busy executive host |
| 5. Video version for YouTube | Discovery and return listening | High | Shows chasing reach |
| 6. Audio fixes | Early exits and cliffs | Medium | Remote-recorded shows |
| 7. Sponsor and CTA placement | Ad-break dips, final minutes | Low | Sponsored or CTA-heavy shows |
| 8. Chapters | Middle and late drop-off | Low | Long episodes |
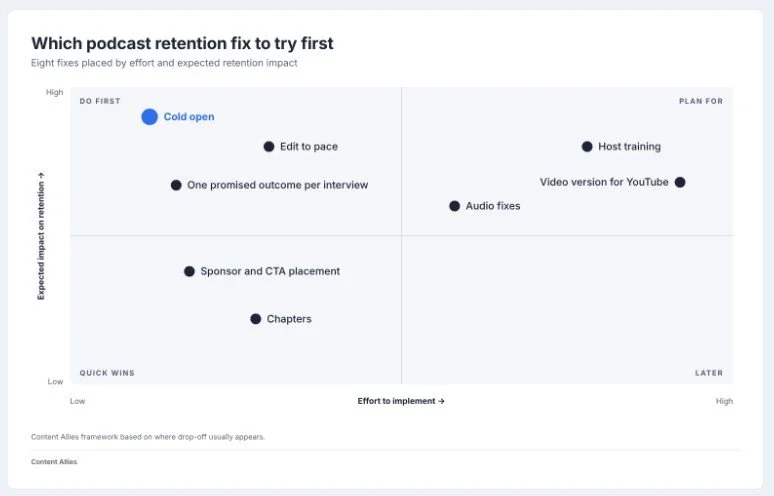
Which podcast retention fix to try first: eight fixes placed by effort and expected impact. Source: Content Allies
1. Replace the Long Intro With a Cold Open
A cold open puts the episode's most useful moment in the first 30 seconds, before the theme music, the welcome and the guest bio. It answers the only question a new listener has: is this worth my time?
Spotify's own example shows the cost of skipping this. A creator whose first season used an intro of about one minute lost around 10% of listeners in that opening stretch.
YouTube measures the same window, reporting what share of viewers is still there after 30 seconds.
This is sometimes also called Average Time to Value: how long an episode takes to give listeners their first taste of what they came for.
To shorten it:
Open with a 15 to 30 second clip of the guest's sharpest answer.
State the episode's promise in one sentence after the clip.
Move sponsor reads, housekeeping and long bios after the first real answer.
2. Edit Every Episode to Its Pace
Editing to pace means cutting at the timestamps your curve flags: the tangent before the cliff, the second version of an answer the guest already gave, the three-minute setup before a story.
Each of those adds length without adding anything a listener came for.
Work through it in this order:
Pull the curve for the last three episodes and note every cliff and long flat slope.
Listen to 60 seconds before each one and mark what was happening.
Cut repeated answers, long wind-ups and off-topic stretches in the next edit.
Re-edit your top five back-catalog episodes, since they keep pulling new listeners.
This is also where an agency earns its fee. Content Allies' production team edits each episode against the previous episodes' retention data, so the cuts follow listener behavior.
3. Build Each Interview Around One Promised Outcome
An interview built around one promised outcome gives listeners a reason to stay until they get it. A title like "How a CFO cut close time from 10 days to four" tells listeners what they'll walk away with.
Put the outcome in three places:
The guest brief, so the guest prepares the specific story.
The first question, so the answer starts inside the first five minutes.
The episode title, so the promise matches what listeners clicked.
Cut warm-up questions about the guest's career path unless the path is the story. Our template for a B2B podcast brief shows how to frame the outcome before recording.
4. Train the Host to Hold Attention
Host delivery drives the middle of the curve. A host who signposts what's coming ("in a minute I want to get to the pricing mistake"), recaps before a new segment, and interrupts a wandering answer keeps listeners oriented.
Three habits make the biggest difference:
Signpost the next payoff before every segment change.
Summarize a long answer in one sentence before the next question.
Cut filler phrases and long verbal warm-ups in your own questions.
Executive hosts are usually the hardest to coach because their time is short.
5. Publish a Video Version Built for YouTube Viewing
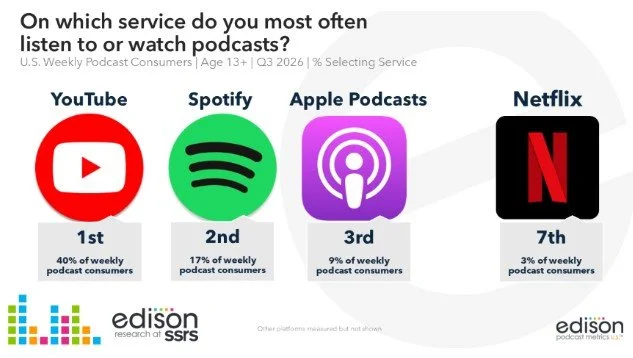
A video version matters because YouTube is where weekly listeners now go first. Edison Research ranks YouTube as the platform US weekly podcast consumers use most frequently (40%), ahead of Spotify at 17% and Apple Podcasts at 9% as of Q3 2026.
Spotify's 2024 Podcast Fan Study found that smaller video shows, with 10 to 100 monthly consumption hours, had a month-to-month listener return rate 26% higher than audio-only shows. This association does not establish that video caused higher episode completion.
Our client Disruptive Innovators saw the reach side of this. The show logged 7,213 YouTube views against roughly 5,281 audio downloads across 53 episodes.
A recorded call doesn't hold viewers by itself. Build for the screen:
Switch camera angles or speakers every 10 to 20 seconds in the edit.
Add lower thirds with the guest's name and the current topic.
Use on-screen chapter cards that match your episode chapters.
6. Fix Audio Problems That Trigger Early Exits
Bad audio causes early exits that look like content problems in the data. A guest on a laptop microphone, a volume jump between speakers, or room echo in the first minute all push listeners out before the content has a chance.
Check the first five minutes of every episode for:
Level differences between host and guest.
Echo, background noise or clipped peaks.
Dropouts in remote recordings.
Fix the source where you can: send guests a microphone, record each side locally, and level every track before publishing.
7. Place Sponsor Reads and CTAs Where They Cost the Least
Sponsor reads cost less retention than most teams expect, as long as the load stays light.
Sounds Profitable's Ad Nauseam study found 46% of listeners say they always or often skip podcast ads, yet 28% say they listen to all of the ads, the highest share of any media channel tested. 73% expect two to three ads in a typical episode of a favorite show.
Ad load also affects advertising performance. An Oxford Road and Podscribe analysis cited by National Public Media found that ad loads above 10% of episode time were associated with advertising conversion rates 25% to 40% lower. Assess listener retention separately using episode analytics.
For your own CTAs and sponsor reads:
Keep total ad time under 10% of the episode.
Place the mid-roll right after a payoff, so listeners have a reason to come back after it.
Ask for one action per episode at the end.
8. Add Chapters That Pull Listeners Forward
Chapters work best when each title promises something specific: "The pricing mistake that cost us a quarter" tells a listener exactly what they'll get. Listeners scanning chapter titles in Apple Podcasts or Spotify decide whether to stay based on those words, and the same titles can anchor your show notes.
The trade-off is that chapters make skipping easy. A listener can jump straight to chapter four, which can lower completion while raising satisfaction. So treat the first chapter as the most important: if it doesn't hold, chapter navigation just speeds up the exit.
How to Get Listeners to Come Back for the Next Episode
Return-listener retention depends on giving listeners a specific reason to come back, at a predictable time. The competition is tight.
Edison Research data from 2021, reported by Amplifi Media, found the average weekly listener gets through about eight episodes from 5.1 different podcasts. Every new episode competes for one of roughly five slots.
Four tactics hold listeners across episodes:
End with a specific reason to return. Name the next guest and the question they'll answer, the same way a trailer sells the show.
Run seasons or series arcs. A four-part series on one problem gives listeners an unfinished story.
Publish on a fixed day. A predictable slot builds the habit. Our data on the B2B podcast release schedule points to biweekly for most B2B teams.
Re-engage lapsed listeners by email. Send the episode most relevant to them with one line on why.
To measure it, read Spotify's week-over-week retention rate and its returning-audience split, then watch follower growth in Apple Podcasts.
How Should B2B Podcasts Measure Retention?
B2B podcasts should measure retention through engaged listeners, episode completion rates, returning listeners, and audience engagement from target accounts. These metrics show how consistently the right audience listens and help businesses evaluate podcast performance alongside sales opportunities, pipeline generation, and revenue.
For a B2B podcast, the listeners who matter most are those from accounts you want to sell to. A show rarely needs a mass audience. It needs the right people to finish episodes and come back.
That changes how you read the data. Apple's Engaged Listeners count, Spotify's returning audience, and completion rates on guest episodes can inform sales and account-based marketing strategies.
Retention sits inside a wider set of B2B podcast KPIs. It helps businesses understand audience attention alongside pipeline and revenue.
| Signal | Where to find it | What it tells sales |
|---|---|---|
| Engaged Listeners | Apple Podcasts Connect | How many people cleared Apple's engagement threshold |
| Returning audience | Spotify for Creators | Whether the show is building a habit with the same people |
| Spikes on YouTube | YouTube Studio key moments | Moments to review for rewatching, sharing or possible confusion |
| Completion on guest episodes | Any platform | Whether listeners stayed through the conversation |
| Firmographic listener data | Tools like CoHost | Which companies are listening |
Our own podcast, Leaders of B2B, shows what this looks like when the audience is chosen on purpose. It engaged 94 C-level executives, generated 43 sales opportunities and produced $100,500 in attributable revenue.
How to Run a Four-Episode Podcast Retention Experiment
A four-episode retention experiment tests one change across four comparable episodes against a fixed baseline. Treat any improvement as preliminary because differences in guests, topics and promotion can also affect retention.
Set the baseline. Record the median Average Consumption, completion rate and 30-second intro hold across your last five comparable episodes.
Test one change across all four episodes. Choose a cold open, a deeper edit, a new ad placement or chapters, and keep other production choices consistent.
Compare at the same window. Record each episode's retention metrics at the same number of days after release so every episode gets the same time to collect data.
Keep, revert or extend. Treat results above the baseline as preliminary and repeat the experiment before making a change standard. Extend the experiment when results are unclear.
| Metric | Baseline | Target | Check window | Result |
|---|---|---|---|---|
| Average Consumption (Apple) | Median of last 5 | +5 points | 30 days | |
| Completion rate (Spotify) | Median of last 5 | +3 points | 7 days | |
| Intro hold at 30 seconds (YouTube) | Median of last 5 | +5 points | 14 days | |
| Engaged Listeners (Apple) | Median of last 5 | +10% | 30 days | |
| Returning audience (Spotify) | Median of last 5 | Up | 30 days |
Read the results with some caution. A popular guest, a newsletter feature or a paid push can lift one episode for reasons unrelated to your change.
Note those events in the scorecard, and repeat any winning change across two more episodes before you make it standard.
Improve Your Podcast Retention With Content Allies
Content Allies is a B2B podcast agency that builds shows around how listeners actually behave. We plan each episode around one promised outcome, write the cold open, edit against the retention curve from your previous episodes, and produce the video version for YouTube.
Then we report on the listeners that matter to your business: engaged listeners, returning audience and the accounts behind them.
If your downloads look fine, but listeners leave early, or your show is growing without producing pipeline, that's the gap we close. Book a strategy call with us, and we'll review your last five episodes' retention data with you and show where the first fixes should go.
FAQs
Why Did My Spotify Retention Rate Suddenly Drop?
Spotify's "retention rate" measures week-over-week returning listeners, which can fall while downloads hold steady. Completion and quartile metrics cover an episode's first seven days, while plays count after at least 30 seconds. Check the metric definition, reporting window and other platforms before changing your show.
Does an ad-break dip count against podcast retention?
No, as long as the curve climbs back to its pre-ad level. Count it as a problem only if the curve stays lower after the break. This pattern points to an ad that's too long or placed before a weak segment.
Should a B2B podcast shorten episodes if completion is below 50%?
Shortening is rarely the first fix. Check where the drop happens: a steep first five minutes points to the opening, and a mid-episode cliff points to one segment. Shorten only if the curve slides steadily across the whole episode.
Do chapters hurt completion rate?
Podcast chapters can lower completion rates if listeners use them to skip sections or jump directly to topics that interest them. However, chapters can also make episodes easier to navigate. Evaluate their impact using completion rates, returning listeners, and engaged listener data.
How many listens do you need before retention data is reliable?
There is no universal number of listens that makes podcast retention data reliable. Apple Podcasts requires at least five unique listeners in the selected period to display analytics, but that threshold does not establish reliability. Small audiences produce more volatile retention curves. As a practical starting point, compare drop-off patterns across three to five similar episodes at the same time after release before changing your format.